blog:2020-03-16:covid-19_spread
This is an old revision of the document!
Table of Contents
COVID-19 Spread
I'm not an epidemiologist, doctor, or any kind of expert on the subject so take this with a grain of salt.
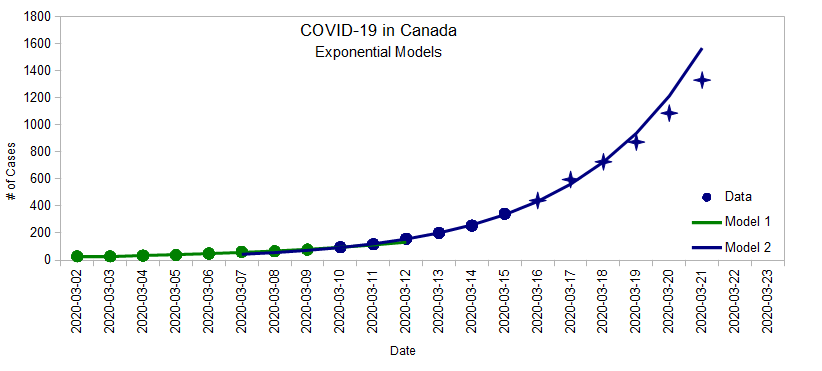
One of the key messages from today's PM announcement is that things will get worse before they get better. I wanted to have a sense of the rate at which COVID-19 is spreading in Canada, so I made a graph, and did some math.
First, I got the data from https://www.covid-19canada.com, plotted it on a graph, and tried to use a basic exponential modem to extract some basic information.
| Date | Count |
|---|---|
| 2020-03-02 | 27 |
| 2020-03-03 | 27 |
| 2020-03-04 | 33 |
| 2020-03-05 | 37 |
| 2020-03-06 | 48 |
| 2020-03-07 | 60 |
| 2020-03-08 | 64 |
| 2020-03-09 | 77 |
| 2020-03-10 | 95 |
| 2020-03-11 | 117 |
| 2020-03-12 | 157 |
| 2020-03-13 | 201 |
| 2020-03-14 | 254 |
| 2020-03-15 | 342 |
blog/2020-03-16/covid-19_spread.1584409410.txt.gz · Last modified: by va7fi

