Antenna Isolation
 Suppose you want to mount two (vertically polarized) antennas for two different radios that will use similar frequencies. How far apart should you mount them so that the radios don't interfere with each other?
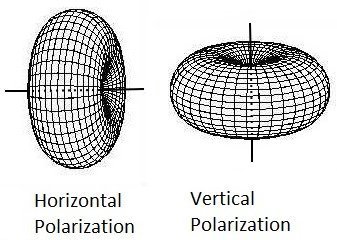
The radiation pattern of a dipole looks like a doughnut, so it makes sense that for a vertically polarized antenna, the “quietest” spots would be right above and below.
The isolation formula for vertical separation is1)2):
\$$ \text{Isolation} =28 + 40 \cdot \log \left(\frac{d}{\lambda}\right) \$$ where:
- λ is the wavelength of the radio frequency used
- d is the vertical separation between the two feed points of the antennas (in the same units as λ)
- the resulting Isolation is in dB
Here's a table and a graph of computed values for separation values \$\frac{d}{\lambda}\$ between 1 and 20 (that is, when the antennas are between 1 wavelength and 20 wavelengths away from each other):
| Separation | Isolation (dB) | Separation | Isolation (dB) | |
|---|---|---|---|---|
| 1 | 28 | 11 | 70 | |
| 2 | 40 | 12 | 71 | |
| 3 | 47 | 13 | 73 | |
| 4 | 52 | 14 | 74 | |
| 5 | 56 | 15 | 75 | |
| 6 | 59 | 16 | 76 | |
| 7 | 62 | 17 | 77 | |
| 8 | 64 | 18 | 78 | |
| 9 | 66 | 19 | 79 | |
| 10 | 68 | 20 | 80 |
So for example, if two antennas used around 147 MHz are 3 m apart (feedpoint to feedpoint), the isolation will be about:
- \$ \lambda = \frac{300}{147} = 2.04 \text{ m} \$
- \$ \text{Isolation} = 28 + 40 \log(\frac{3 \text{ m}}{2.04 \text{ m}}) \approx 35 \text{ dB} \$
And if we wanted 70 dB of isolation, from the table, we see that we'd need the two antennas separated by 11 wavelengths, which at 147 MHz would be: \$11 \times \frac{300}{147} \approx 22 \text{ m}\$.
The first thing to note is that there's a sort of “diminishing returns” thing going on: the greater the separation, the greater the isolation. But each additional meter of separation doesn't give the same isolation. But there's a neat trick to it. Here are a few specially chosen numbers from the table again. See if you can spot a pattern:
| Separation | Isolation (dB) |
|---|---|
| 1 | 28 |
| 2 | 40 |
| 4 | 52 |
| 8 | 64 |
| 16 | 76 |
The way to think of it is that a separation of 1 wavelength gives an isolation of 28 dB. But then, every doubling of the separation adds another 12 dB of isolation. Going from 1 to 2 adds 12 dB, but to get an additional 12 dB, you need to go from 2 to 4, and then from 4 to 8, etc.
For the math geeks, here's how to get the 12 dB to come out of the isolation formula:
Logarithms can be expressed in any base that we find convenient. The original formula is in base 10, but we could convert it to base 2 : \$$ 40 \log_{10}(x) = 40 \frac{\log_2(x)}{\log_2(10)} = \frac{40}{\log_2(10)} \cdot \log_2(x) = 40\log_{10}(2) \cdot \log_2(x) \approx 12 \log_2(x)\$$
So these two formulas are really the same: \$$ \text{Isolation} =28 + 40 \cdot \log \left(\frac{d}{\lambda}\right) \qquad \text{or} \qquad \text{Isolation} = 28 + 12 \cdot \log_2 \left(\frac{d}{\lambda}\right) \$$
They both say: when the separation is one wavelength, the isolation will be 28 dB.
- But then the first one says: every time you multiply that separation by 10 (1, 10, 100, 1000, etc), you'll add 40 dB of isolation.
- And the second one says: every time you multiply that separation by 2 (1, 2, 4, 8, 16, etc), you'll add 12 dB of isolation.
Finally, if we look at the graph above but stretch the horizontal axis so that the separation between 1 and 2 is the same as that between 2 and 4, and between 4 and 8, etc, we get a semi-log plot like this:
