This is an old revision of the document!
Table of Contents
COVID-19 Spread (Part II)
- I'm not an epidemiologist, doctor, or any kind of expert on the subject. I just look at the numbers.
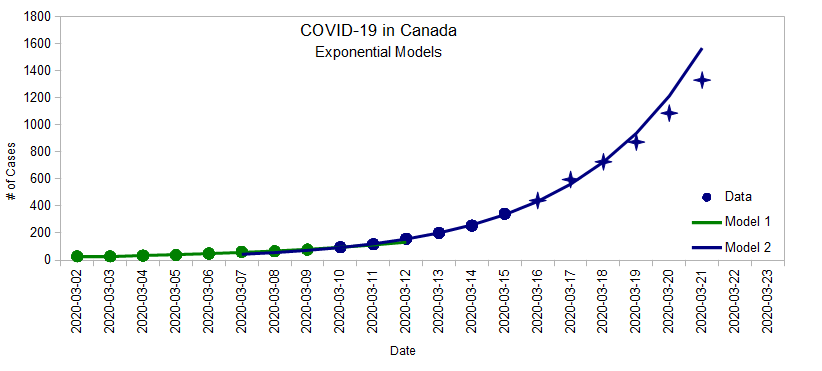
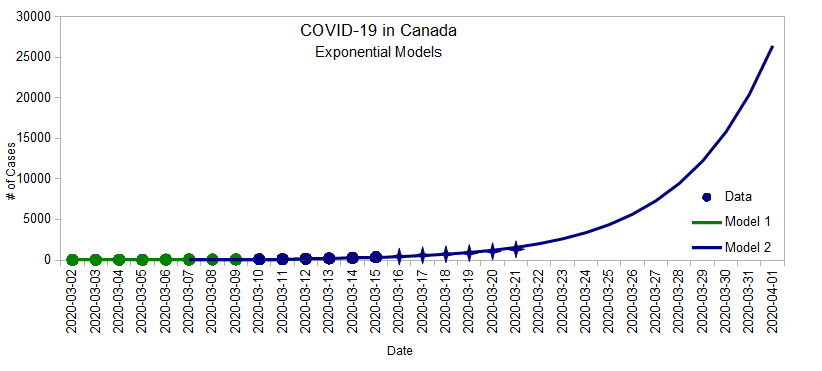
In Part I, I built an exponential model using data between March 2 and March 15, then continued to add daily numbers to see how that model tracked:
Initially, the number of cases doubled every 2.7 days, predicting almost 1600 cases by the end of Saturday, but since Thursday, the rate of infection seems to have slowed down a bit and we got about 240 cases less than predicted. This deviation from the exponential model is what I'm exploring here.
Growth Factor
There's a ratio involving three data points that's useful to track how “fast” the exponential grows. It's easier to explain with an example so suppose we had three days like this:
| Day | # of Cases | New Cases | Growth Factor |
|---|---|---|---|
| Day1 | 100 | ||
| Day2 | 110 | 10 | |
| Day3 | 130 | 20 | 2 |
To calculate the growth factor:
- The first step is to calculate the number of new cases from one day to the next.
- Then, we take the ratio between the number of new cases (20 ÷ 10 = 2)
- If the growth factor is above 1, it means we're still in the exponential phase, growing faster and faster day after day.
- If the growth factor is 1, then the infection is growing at a constant rate. This is the middle of the Logistic Curve (more on that soon).
- If the growth factor is less than 1, then the infection rate is levelling off.
Here's the number of cases in Canada with the calculated growth factor:
| Date | # of Cases | New Cases | Growth Factor |
|---|---|---|---|
| 2020-03-01 | ? | ||
| 2020-03-02 | 27 | ||
| 2020-03-03 | 27 | 0 | |
| 2020-03-04 | 33 | 6 | |
| 2020-03-05 | 37 | 4 | 0.67 |
| 2020-03-06 | 48 | 11 | 2.75 |
| 2020-03-07 | 60 | 12 | 1.09 |
| 2020-03-08 | 64 | 4 | 0.33 |
| 2020-03-09 | 77 | 14 | 3.25 |
| 2020-03-10 | 95 | 18 | 1.38 |
| 2020-03-11 | 117 | 22 | 1.22 |
| 2020-03-12 | 157 | 40 | 1.82 |
| 2020-03-13 | 201 | 44 | 1.10 |
| 2020-03-14 | 254 | 53 | 1.20 |
| 2020-03-15 | 342 | 88 | 1.66 |
| 2020-03-16 | 441 | 99 | 1.33 |
| 2020-03-17 | 596 | 155 | 1.57 |
| 2020-03-18 | 727 | 131 | 0.85 |
| 2020-03-19 | 873 | 146 | 1.11 |
| 2020-03-20 | 1087 | 214 | 1.47 |
| 2020-03-21 | 1331 | 244 | 1.14 |
There's a lot of variation in the growth factor because real life is messy, but if we plot it on a graph, we can see a bit of a pattern:

Although the growth factor is still above 1, it looks like we might be on track to reach 1 by the end of the month. If that's the case, and if we continue to implement measures to slow the down the spread, then we'll be in a better position to estimate the final outcome by the end of the month. Here's why.
The Logistic Curve
In Part I, I showed very different Logistic Curves and explained that there's really no way of knowing which we'll follow yet. Here they are again:
- Model 3 is the very best case scenario where the total number will be double of what it is today. This assumes that the growth factor reached 1 yesterday (March 21), which it hasn't.
- Model 4 is a very likely scenario where the total number reaches 20,000 and the growth factor reaches 1 on April 1st. This is not a worst case scenario. Things could be much worse (look at Italy).
- Model 5 is an optimistic scenario where the total number reaches 12,000 and the growth factor reaches 1 on March 30st.
The thing to know about Logistic Curves is that in the middle, the growth factor is 1. That's why we can't really make any prediction until we reach that point. Hopefully that'll be soon. Until then, things are still very much in the air.
COVID-19 Spread (Part I)
So there's a very real sense in which, if we don't do anything different, we could simply be about 15 days behind Italy...
But doing the right things can change that future. In reality, the spread of the infection follows more of a Logistic Function. At the beginning, it looks like an exponential, but then it flattens out. This is what the news keeps referring to when they say that social distancing and proper hand washing can help “flattening the curve” more quickly.
 The real question is how soon will we reach that middle point, and at what height.
Here's a good video that explains this sort of math and why being able to think in exponential term is important for non-linear systems such as this one.
And here's another one with different animations that complements it very nicely.
Here's an interesting article from The Washington Post showing basic random simulations for four different cases (free-for-all, attempted quarantine, mild moderate distancing, extensive social distancing).


