This is an old revision of the document!
Table of Contents
COVID-19 Spread (Part II)
- I'm not an epidemiologist, doctor, or any kind of expert on the subject. I just look at the numbers.
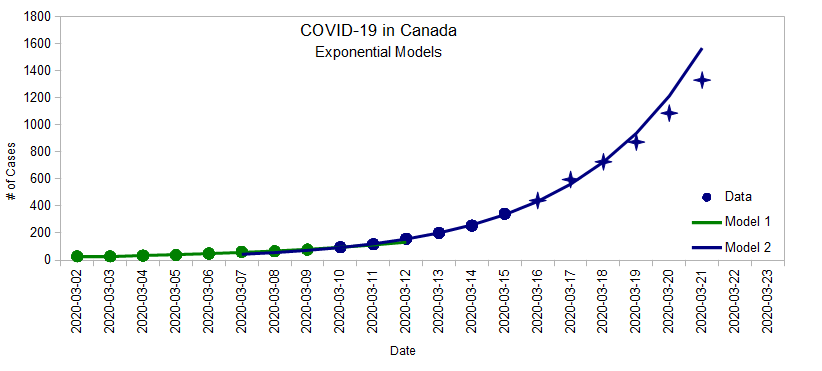
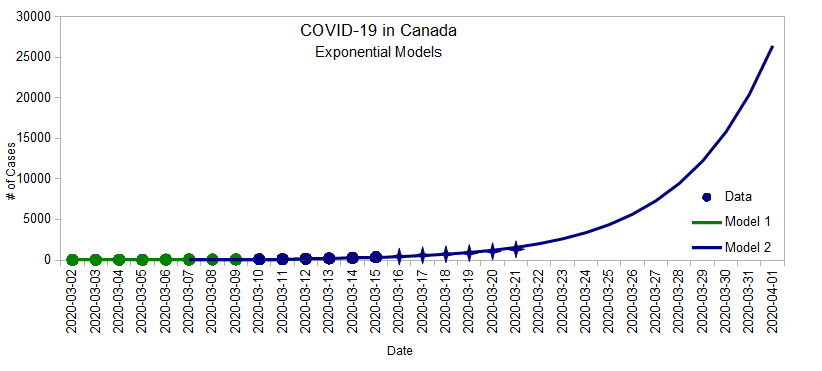
In Part I, I built an exponential model using data between March 2 and March 15, then continued to add daily numbers to see how that model tracked:
Initially, the number of cases doubled every 2.7 days, predicting almost 1600 cases by the end of Saturday March 21, but since Thursday, the infection rate seems to have slowed down a bit and we got about 1331 cases instead. This deviation from the exponential model is what I explore below.
Growth Factor
There's a ratio involving three data points that's useful to track how “fast” the exponential grows. It's easier to explain with an example, so suppose we had three days like this:
| Day | # of Cases | New Cases | Growth Factor |
|---|---|---|---|
| Day1 | 100 | ||
| Day2 | 110 | 10 | |
| Day3 | 130 | 20 | 2 |
To calculate the growth factor:
- Take the number of new cases from one day to the next (10 new cases from Day 1 to Day 2, 20 new cases from Day 2 to Day 3)
- Then, take the ratio between new cases (20 ÷ 10 = 2)
- If the growth factor > 1, the number of new cases is itself increasing each day, which means we are still in the exponential phase.
- If the growth factor = 1, then the number of cases is growing at a constant rate (same amount each day). This is the middle of the Logistic Curve (more on that soon).
- If the growth factor < 1, then the infection rate is levelling off.
Here are the number of cases in Canada with the calculated growth factors:
| Date | # of Cases | New Cases | Growth Factor |
|---|---|---|---|
| 2020-03-01 | ? | ||
| 2020-03-02 | 27 | ||
| 2020-03-03 | 27 | 0 | |
| 2020-03-04 | 33 | 6 | |
| 2020-03-05 | 37 | 4 | 0.67 |
| 2020-03-06 | 48 | 11 | 2.75 |
| 2020-03-07 | 60 | 12 | 1.09 |
| 2020-03-08 | 64 | 4 | 0.33 |
| 2020-03-09 | 77 | 14 | 3.25 |
| 2020-03-10 | 95 | 18 | 1.38 |
| 2020-03-11 | 117 | 22 | 1.22 |
| 2020-03-12 | 157 | 40 | 1.82 |
| 2020-03-13 | 201 | 44 | 1.10 |
| 2020-03-14 | 254 | 53 | 1.20 |
| 2020-03-15 | 342 | 88 | 1.66 |
| Date | # of Cases | New Cases | Growth Factor |
|---|---|---|---|
| 2020-03-16 | 441 | 99 | 1.33 |
| 2020-03-17 | 596 | 155 | 1.57 |
| 2020-03-18 | 727 | 131 | 0.85 |
| 2020-03-19 | 873 | 146 | 1.11 |
| 2020-03-20 | 1087 | 214 | 1.47 |
| 2020-03-21 | 1331 | 244 | 1.14 |
| 2020-03-221) | |||
| 2020-03-23 | 2091 | 380 | 1.56 |
| 2020-03-24 | 2792 | 701 | 1.84 |
| 2020-03-25 | |||
| 2020-03-26 | |||
| 2020-03-27 | |||
| 2020-03-28 | |||
| 2020-03-29 | |||
| 2020-03-30 |
There's a lot of variation in the growth factor because real life is messy. It's also worth keeping in mind that the numbers we see are contingent on how much testing we do. It's easy to imagine that testing labs are lagging a few days behind and that they'll sometimes be able to report more results one day and less the next.
We don't have an accurate picture of the world here so it's hard to make any kind of hard predictions. Never-the-less, as of March 21, there seemed to be a loosely decreasing pattern:

Overall, the growth factor is mostly above 1 (in the exponential phase), but it looks like we might be on track to reach 1 by the end of the month (end of exponential phase). If that's the case, and if we continue to implement measures to slow the down the spread, then we'll be in a better position to estimate the final outcome by the end of the month. Here's why.
The Logistic Curve
In Part I, we saw that very different Logistic Curves can fit the current data, and that there's really no way of knowing which path we're on yet. Here they are again:
- Logistic 1 is the very best case scenario where the total number will be double of what it is today. This assumes that the growth factor reached 1 yesterday (March 21), which it hasn't.
- Logistic 2 is an optimistic scenario where the total number reaches 12,000 and the growth factor reaches 1 on March 30st.
- Logistic 3 is a very likely scenario where the total number reaches 20,000 and the growth factor reaches 1 on April 1st. This is not a worst case scenario. Things could be much worse (look at Italy).
There's a few things to know about the Logistic Curve, in the middle:
- The curve is flat like a straight line, which indicates that the growth rate is constant.
- This means that the growth factor is 1 (by definition)
- It also happens that this is the halfway point in terms of total number of cases.
So once we reach that point, we'll be able to get a better estimate of where we'll end up. Until then, things are still very much in the air.
March 24th Update
A lot happened at the beginning of the week:
- BC seems to be dropping the ball on testing. Their reported numbers are proportionally much lower than Quebec and Ontario, which indicates we are simply not testing enough.
- Quebec went the opposite way, increasing their testing.
Over all, it looks like we are back on the exponential curve with an overall doubling time of 3.1 days:
The Growth Factor also seems to support this as it no longer seems to be decreasing.

Over a week ago, when we only had 342 cases, the model predicted we were about two weeks behind Italy (which had 26,000 cases at the time). The updated model (doubling every 3.1 days) predicts that we are 15 days behind Italy (with over 69,000 cases). What we are doing is not working.


