Table of Contents
Covid-19 Spread (Part III)
A year ago, I wrote two posts looking at the Covid-19 numbers for Canada.
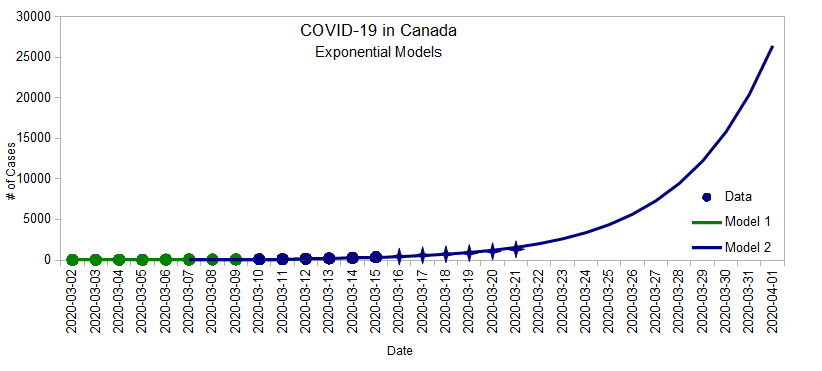
- Part I looked at a basic exponential model built at a time (mid-March 2020) when we only had 350 reported cases across the country. It predicted that we'd have 26,000 cases two weeks later, which sounded absolutely crazy. It was wrong by about two weeks. We hit 26,000 in mid-April 2020.

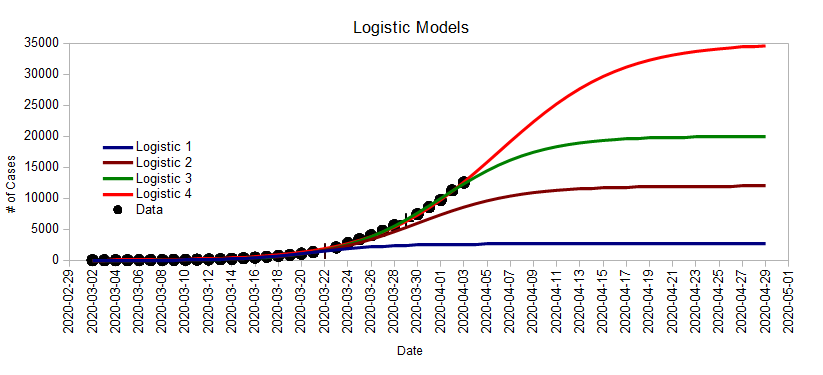
- Part II (written at the beginning of April 2020) looked at different logistics models that we could fall on depending on how hard we worked at flattening the curve.

That didn't happen either. As of today, we have 927,069 cases country-wide.

The reality is much more complicated than either of these two simple models (exponential and logistics). But they are nonetheless still very useful to break things down into different parts:
- From the beginning until June 2020, the infection curve was roughly logistics with a plateau of a little over 100,000 cases (the first wave).
- But then in September 2020 it kicked into exponential gears again (the second wave).
- It looked like it was starting to plateau again in mid-January 2021, but instead, we might be headed into a third wave.
I created a public spreadsheet to analyze all of this in more details. In particular, I use four different graphs to gain insights into where things are going.
The total Covid-19 count
This graph is a “smoothed out” version of the actual reported counts. Testing backlogs that get caught up later creates noise in the original data that I reduced using a 7-day running average, which seemed to be a good balance between details and noise level.
The number of new daily cases
 This graph represents the number of new cases each day. Mathematically, it's the first derivative of the previous graph. Numerically, I computed the slope of 5-day secants of the smoothed curve, again to reduce noise of the overall trend.
Here, we clearly see:
- the first wave until June 2020
- the lull from June 2020 to September 2020
- the second wave from September 2020 to February 2021
- the beginning of the third wave in March 2021.
And the scary thing is that each wave seems to be bigger than the previous one.
The daily change in daily cases
 This graph is a little more abstract: it represents the daily increase of daily cases. Mathematically, this is the second derivative of the first graph, which is a measure of acceleration.
When this graph is negative, the number of new cases each day is decreasing. When it's zero, the number of new cases each day is the same. And when it's above zero, the number of new cases each day increases each day.
We can see that in January, we started putting the breaks on the second wave, except we are now accelerating again towards a third wave.
The doubling time
 This last graph represents the time (in days) that it would take to double the total number of cases were the trend to continue. Here, the vertical axis is a time scale (in days), not a number of infections.
A small number is bad because it means the total number of cases doubles in a short amount of time.
For example, between October and January, the doubling time was roughly 50 days, and looking back at the first graph, we can see that the number of cases doubled in about that time.
A constant doubling time means that the growth is exponential. An infinite doubling time means no more new cases. We can see that the doubling time of 200 days we had last month is starting to decrease, again indicating that we are starting a new wave.
BC, Alberta, Canada
Finally, I do this same analysis for BC and Alberta as well as Canada. The spreadsheet includes the calculations, the raw data, and the source of the data on the government website. I'll probably be updating the numbers every week or two.